Many businesses use dashboards today. Some even use more than one. But what makes it really work? The secret often lies in the design. Thank the stars, you don’t have to start from scratch each time. There are dashboard templates that save time (quite a lot, in fact). Thanks to those, your data looks good and actually makes sense.
What’s a Dashboard?
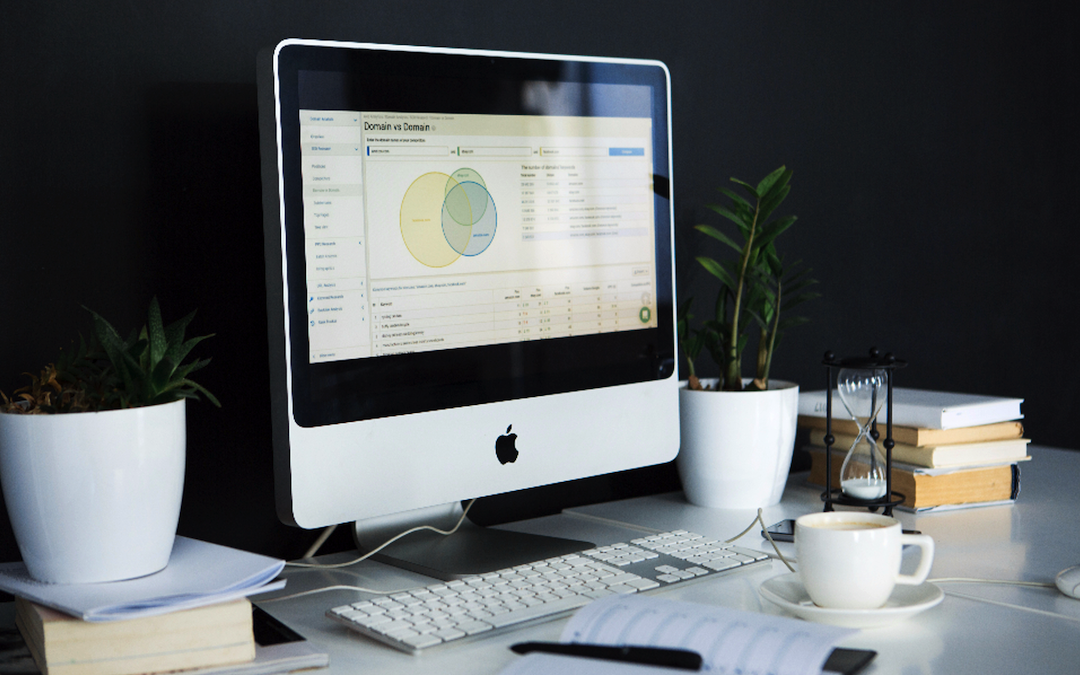
A dashboard is a visual display of key business metrics. It lets you control your company’s data. Or, some of it, if you decide so. It pulls info from different sources and presents it in one place.
Usually, you take a dashboard template and customize it so that it helps you to
- see trends,
- track progress,
- and make decisions fast.
Your Dashboard: Best Practices
So instead of designing dashboards from scratch, you normally use website dashboard templates. You still need to keep in mind the dashboard best practices when working with them. You can find some of those below (but there are more, of course).
1. Keep It Simple
Less is often more. Don’t overload your dashboard with too much info. Focus on the key metrics. For example, on
- Sales figures
- Customer satisfaction scores
- Employee performance metrics
- Financial data
- Key performance indicators (KPIs).
2. Use Clear Labels and Titles
Every chart and graph should have clear labels and titles. This helps users understand what they’re looking at. Use descriptive titles. For instance, use “Monthly Sales Growth” instead of just “Sales”.
3. Choose the Right Visuals
Different data requires different visuals. You’d normally use
- bar charts for comparisons,
- line charts for trends,
- and pie charts for proportions.
The right visual makes your data easier to understand. Plus, most people expect certain data types to be visualized in a certain manner (like in the examples above). And it’s generally good for a design to meet users’ expectations. That’s why it’s called intuitive.
4. Organize Logically
Place related metrics next to each other. Group sales data together, financial data in another section, and so on. This makes it easier for users to see trends or correlations.
5. Make It Interactive
Interactive elements let users independently explore data. They can include filters, drill-down options, and other dashboard UI components. Such elements allow deeper analysis but don’t clutter the main view.
Key Aspects of Effective Dashboard Design
Besides, it’s always useful to keep in mind some aspects that constitute good dashboard UI designs.
Audience Needs
Consider who will use the dashboard. Are they executives that need a high-level overview? Or are they analysts who want detailed data? The thing is that different users have different needs. And if there will be several user types, you’ll need to attend to several different needs.
Here are a few ideas for how to identify users' needs:
- Conduct targeted interviews (use specific scenarios in them);
- Tailored surveys (they should include questions that can potentially uncover deeper insights);
- Hands-on user testing (use a clickable prototype of the dashboard for that);
- Role-specific analysis (make a map of the daily routines of different roles within the organization for that)
- Structured feedback loops.
Data Accuracy
Of course, it is super important that the data displayed is accurate and up-to-date. Otherwise, the dashboard is useless, right? The most straightforward thing to do here is to set up automated data refreshes.
Data validation rules can likewise help catch errors. Another method is to use anomaly detection algorithms that flag unusual patterns or outliers. It prompts a review before presenting the data.
And finally, there’s a change log. It can track updates and modifications to the data and give you a clear history of data changes.
Responsive Design
People (many of them, at least) work on the go. And that’s why dashboards should use responsive design to be accessible on various devices — desktops, tablets, and smartphones. If they aren’t, users will likely ignore them and look for alternative ways to access data.
Consistent Color Scheme
One of the dashboard design tips ever is to use a consistent color scheme throughout the dashboard. Just stick to a palette that aligns with your brand. This will make the dashboard look professional. Plus, it will be easier to use.
Feedback Loops
Always include ways for users to give feedback. The latter is the only guarantee that the tool remains relevant and user-friendly. Plus, users may develop new needs that should be incorporated into the dashboard design.
Final Thoughts
As you now see, designing an effective dashboard isn’t super hard (especially if you are using a good template). So follow the best practices. Keep in mind the core aspects described above. Try to make it functional but always remember that it must be a pleasure to use, too. Strive for clarity, simplicity, and usability in the first place.
 FAQs
FAQs
Update in real-time or daily. This way, data will be accurate and reflect the current business state.
Common mistakes include overwhelming users with too much information, using confusing visuals, ignoring user needs, and displaying outdated data. Instead, focus on key metrics. Match visuals to data types and tailor the dashboard to your audience. It’s also a good idea to set up automated data refreshes.
Yes, by using historical data to forecast trends. For example, tracking sales over time can help predict future sales. Thanks to this, businesses can anticipate changes and plan accordingly.
Provide training and user guides. Let users ask questions and respond to those promptly.
Advanced features include real-time updates, predictive analytics, customizable views, system integration, and advanced filters.
Share this post
Leave a comment
All comments are moderated. Spammy and bot submitted comments are deleted. Please submit the comments that are helpful to others, and we'll approve your comments. A comment that includes outbound link will only be approved if the content is relevant to the topic, and has some value to our readers.
Comments (0)
No comment